Imgui(2) | macOS 绘制 CPU 占用率曲线
文章目录
- Imgui(2) | macOS 绘制 CPU 占用率曲线
- 0. 简介
- 1. 绘制曲线 - 以正弦函数为例
- 1.1 基于 `sf::RectangleShape` 的渲染 - 不好看,效率低
- 1.2 基于 `sf::VertexArray` 的绘制
- 2. 获取和绘制所有 CPU 的占用率
- 2.1 测试程序 - 用满所有 CPU
- 2.2 获取 CPU 占用率
- 2.3 SFML获取和绘制cpu占用率
- 2.4 效果和小节
- 3. 增加按钮: 在界面上开启和关闭评测程序
- 3.1 改造测试代码
- 3.2 引入 imgui-SFML, 增加按钮
- 4. 提高绘制频率
- 5. 总结
- References
0. 简介
实现一个 CPU 占用率曲线绘制的程序, 并能通过按钮触发评测代码的运行; 跨平台。 使用到了 SFML, imgui-SFML, 以及 macOS 平台特有的 API.
规划:
- 绘制曲线 - 以正弦函数为例
- 获取和绘制所有 CPU 的占用率
- 增加按钮: 在界面上开启和关闭评测程序
- 提高绘制频率
started: 2024.02.14 10:30~15:30
1. 绘制曲线 - 以正弦函数为例
以 y = sin(x) 获得一系列坐标点, 使用 sf::VertexArray 进行绘制, 得到相对平滑的结果, 且渲染效率较高。
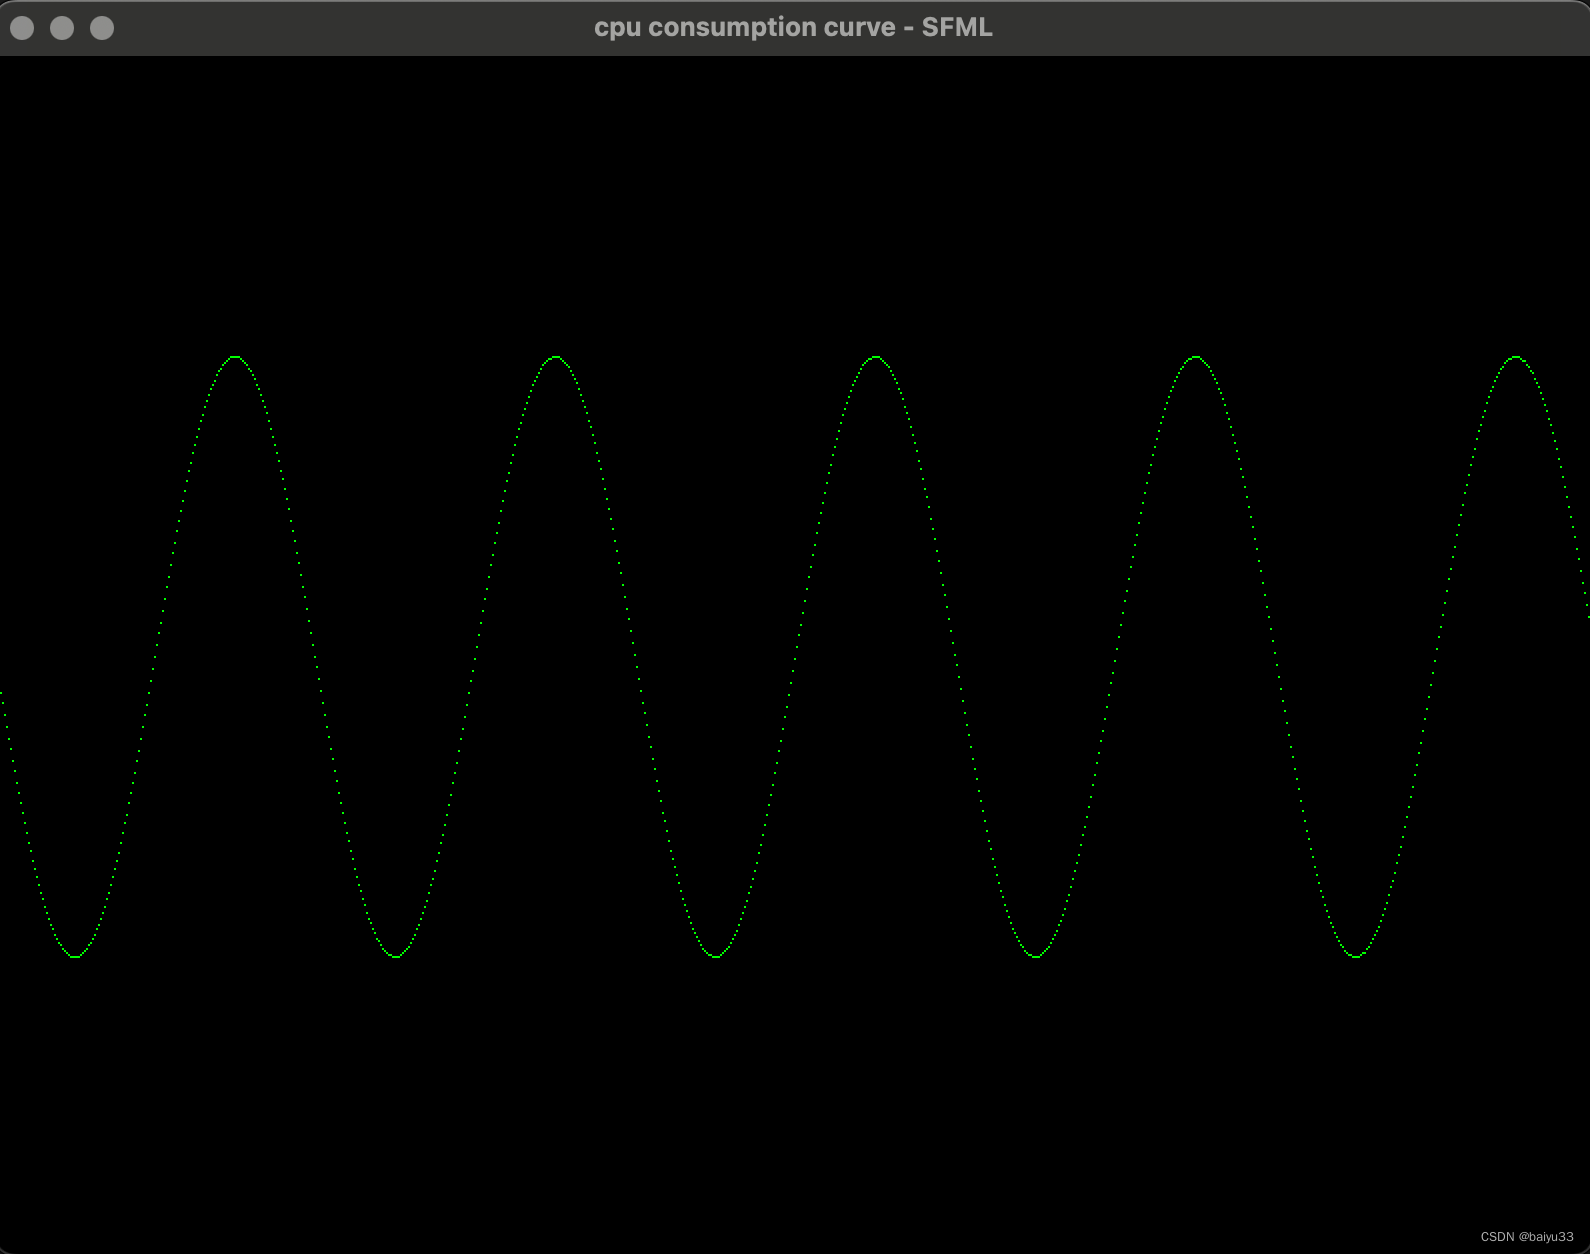
1.1 基于 sf::RectangleShape 的渲染 - 不好看,效率低
开始时候我用 sf::RectangleShape 执行单个坐标点的绘制, 存在这些问题:
- 相邻点之间没有连线,锯齿感明显
- 每个点调用一次
window.draw(), GPU 利用率不高
#include <SFML/Graphics.hpp>int main()
{constexpr int win_width = 800;constexpr int win_height = 600;const std::string title = "cpu consumption curve - SFML";sf::RenderWindow window(sf::VideoMode(win_width, win_height), title);window.setFramerateLimit(10);constexpr int grid_len = 1;int idx = 0;while (window.isOpen()){sf::Event event;while (window.pollEvent(event)){if (event.type == sf::Event::Closed){window.close();}}window.clear();// draw heresf::RectangleShape rect(sf::Vector2f(grid_len, grid_len));rect.setFillColor(sf::Color::Green);for (int i = 0; i < win_width; i++){float x = (i * 1.0 / win_width) * 10 * 3.14;float y = sin(x) * win_height/4 + win_height/2 - grid_len/2;rect.setPosition(i, y); // centerwindow.draw(rect);}window.display();}return 0;
}
1.2 基于 sf::VertexArray 的绘制
在 SFML Tutorial - Designing your own entities with vertex arrays 文档提到, 多次调用 window.draw() 效率很低, 很容易到达显卡极限。 好的做法是使用 sf::Vertext 把要绘制的东西一次性准备好, 只调用一次 window.draw():
SFML provides simple classes for the most common 2D entities. And while more complex entities can easily be created from these building blocks, it isn’t always the most efficient solution. For example, you’ll reach the limits of your graphics card very quickly if you draw a large number of sprites. The reason is that performance depends in large part on the number of calls to the draw function. Indeed, each call involves setting a set of OpenGL states, resetting matrices, changing textures, etc. All of this is required even when simply drawing two triangles (a sprite). This is far from optimal for your graphics card: Today’s GPUs are designed to process large batches of triangles, typically several thousand to millions.
To fill this gap, SFML provides a lower-level mechanism to draw things: Vertex arrays. As a matter of fact, vertex arrays are used internally by all other SFML classes. They allow for a more flexible definition of 2D entities, containing as many triangles as you need. They even allow drawing points or lines.
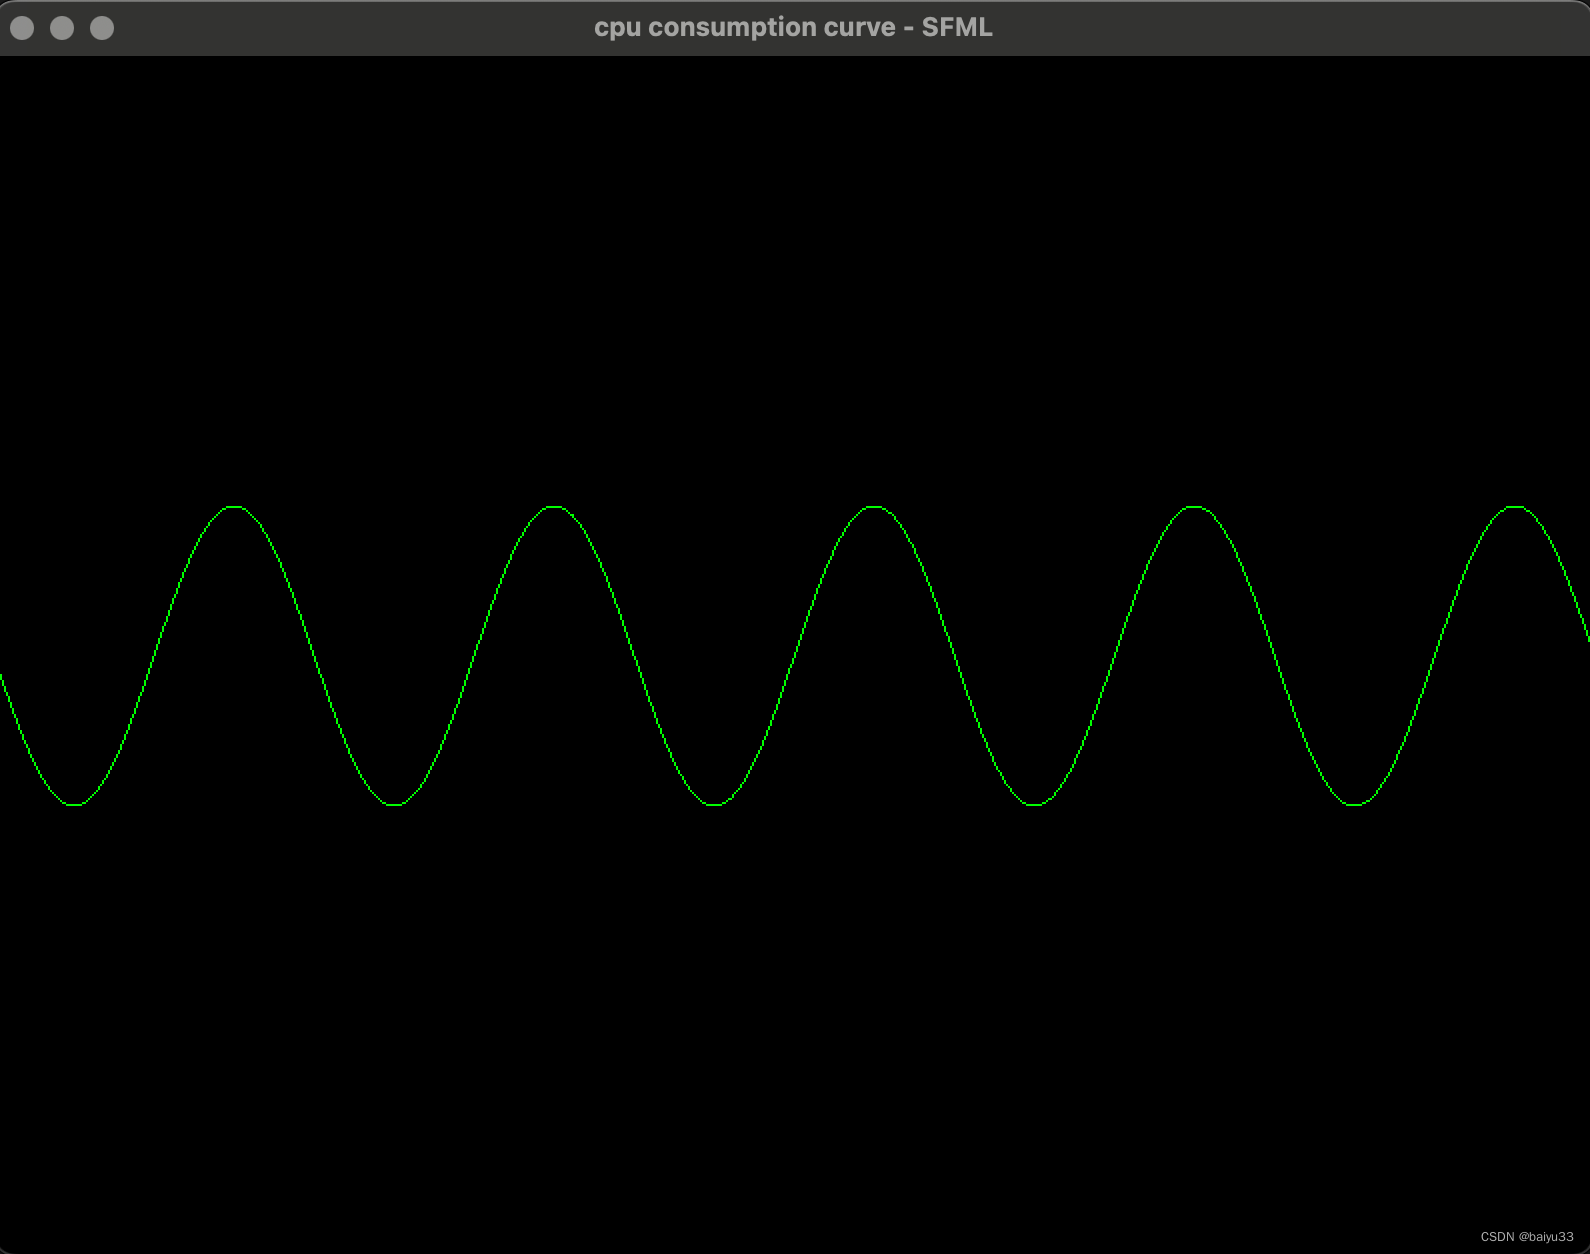
关键代码修改如下:
// draw here
// sf::RectangleShape rect(sf::Vector2f(grid_len, grid_len));
// rect.setFillColor(sf::Color::Green);
// for (int i = 0; i < win_width; i++)
// {
//     float x = (i * 1.0 / win_width) * 10 * 3.14;
//     float y = sin(x) * win_height/8 + win_height/2 - grid_len/2;
//     rect.setPosition(i, y); // center
//     window.draw(rect); // 原来: 在一帧内多次调用 window.draw(), 渲染效率低
// }sf::VertexArray line(sf::LineStrip, win_width);
for (int i = 0; i < win_width; i++)
{float x = (i * 1.0 / win_width) * 10 * 3.14;float y = sin(x) * win_height/8 + win_height/2 - grid_len/2;line[i].position = sf::Vector2f(i, y);line[i].color = sf::Color::Green;
}
window.draw(line); // 现在: 在一帧内只调用一次 window.draw(), 渲染效率高
2. 获取和绘制所有 CPU 的占用率
MacOS 禁止用户自行设定 CPU 亲和性 (Affinity), 尝试过编译运行 “只有 while 死循环” 的程序,占用的 CPU 会跳来跳去。 与其飘忽不定, 不如开启多个线程: 我的 Mac-Mini 有 8 个 CPU, 因此开启 8 个线程, 每个线程都运行一样的死循环代码, 然后获取所有 CPU 的占用率并绘制曲线。
2.1 测试程序 - 用满所有 CPU
在开启 nproc 个线程时, 虽然操作系统不一定是把每个线程分配到不同的 CPU 上, 但电脑整体比较空闲的情况下, 大概率是可以确保这个理想分配的。
性能测试程序代码:
#include <thread>void run()
{int i = 0;while (true){i++;}
}int main()
{constexpr int n = 8;std::thread threads[n];for (int i = 0; i < n; i++){threads[i] = std::thread(run);}for (int i = 0; i < n; i++){threads[i].join();}return 0;
}
2.2 获取 CPU 占用率
参照了 c++获取windows、mac的cpu利用率 这篇文章, 获取了 macOS 下的 CPU 整体占用率, 关键函数是 host_statistics(), 位于 mach/mach_host.h, 但是没有任何注释。 这篇参考博客的做法是, 每隔 1 秒调用一次 host_statistics() 来获得 cpu 相关信息, 两次调用的结果做差值, 得到的差值里的几个时间, 构成了 cpu 占用率:
CPU占用百分比 = (user时间 + system时间 + nice时间) / (上面👆这一坨,再加上 idle 时间) * 100
#include <mach/mach.h>
#include <sys/types.h>
#include <sys/sysctl.h>#define CP_USER   0
#define CP_SYS    1
#define CP_IDLE   2
#define CP_NICE   3
#define CP_STATES 4host_cpu_load_info_data_t load1, load2;host_cpu_load_info_data_t get_cpu_percentage()
{kern_return_t error;mach_msg_type_number_t count;host_cpu_load_info_data_t r_load;mach_port_t mach_port;count = HOST_CPU_LOAD_INFO_COUNT;mach_port = mach_host_self();error = host_statistics(mach_port, HOST_CPU_LOAD_INFO, (host_info_t)&r_load, &count);if (error != KERN_SUCCESS){return host_cpu_load_info_data_t();}return r_load;
}float getCpuUsePercentage()
{load2 = get_cpu_percentage();// pre load timesunsigned long long current_user = load1.cpu_ticks[CP_USER];unsigned long long current_system = load1.cpu_ticks[CP_SYS];unsigned long long current_nice = load1.cpu_ticks[CP_NICE];unsigned long long current_idle = load1.cpu_ticks[CP_IDLE];// Current load timesunsigned long long next_user = load2.cpu_ticks[CP_USER];unsigned long long next_system = load2.cpu_ticks[CP_SYS];unsigned long long next_nice = load2.cpu_ticks[CP_NICE];unsigned long long next_idle = load2.cpu_ticks[CP_IDLE];// Difference between the twounsigned long long diff_user = next_user - current_user;unsigned long long diff_system = next_system - current_system;unsigned long long diff_nice = next_nice - current_nice;unsigned long long diff_idle = next_idle - current_idle;float value = static_cast<float>(diff_user + diff_system + diff_nice) / static_cast<float>(diff_user + diff_system + diff_nice + diff_idle) * 100.0;load1 = load2;return value;
}
2.3 SFML获取和绘制cpu占用率
设置了FPS不超过 60, 每60帧获取一次 CPU 占用率(从而更新需要绘制的数据), 每一帧都绘制当前的 CPU 占用率。
更新数据指的是, 对于绘制任务, 每个数据在时间维度上, 相当于左移一个单位, 因此搬运需要显示的数据数量 num_bins 再减去 1 个的数据,都搬运到它前面一个, 然后填充最后一个数据, 就完成了更新, 在画面上变现为: 原来的 CPU 占用率折线被向左平移了 1 个bin的单位。 每一帧的更新数据和渲染, 代码如下:
frameIdx++;if (frameIdx % 60 == 0){load2 = get_cpu_percentage();float cpu_use = getCpuUsePercentage();for (int i = 0; i < num_bins - 1; i++){cpu_usage[i] = cpu_usage[i + 1];}cpu_usage[num_bins - 1] = cpu_use;frameIdx = 0;}sf::VertexArray line(sf::LinesStrip, num_bins);for (int i = 0; i < num_bins; i++){float usage = cpu_usage[i];float x = i * bin_size;float y = win_height - (usage / 100) * win_height;line[i].position = sf::Vector2f(x, y);}window.draw(line);printf("cpu_usage[%d] = %f\n", num_bins - 1, cpu_usage[num_bins - 1]);
2.4 效果和小节
通过使用 SFML 和 macOS 的 API, 获取并绘制了总体的 CPU 占用率, 通过编写和开启测试程序, 在开启 4 个线程的情况下, 可以看到 CPU 占用率在 50% 左右:
3. 增加按钮: 在界面上开启和关闭评测程序
按钮是 GUI 的组件, 这一节需要使用 imgui 和 imgui-SFML.
3.1 改造测试代码
需要改造评测代码, 让它能够被随时开启和关闭:
- 在 GUI 方面, 增加 start benchmark 和 stop benchmark 按钮, 来控制测试代码的开启和关闭
- 在代码实现层面:
- 重构原有的测试代码,让它的 while(true) 改为 while(running), running 是
std::atomic<bool>类型 - 在 SFML 的 main loop 中集成: 增加按钮按下的响应事件
- 在响应事件函数
startBenchmark()和stopBenchmark()函数中, 通过创建和效果新的线程,在线程中运行、等待测试代码
- 重构原有的测试代码,让它的 while(true) 改为 while(running), running 是
非阻塞的响应
其中按钮的响应函数中, 如果没有通过新开线程来执行测试代码, 会导致界面卡死。 使用了新开线程后则不会。关键代码:
BenchmarkRunner runner; // 被测试的代码, 封装为了类
std::thread benchmark_thread;void startBenchmark()
{runner.running = true;benchmark_thread = std::thread(&BenchmarkRunner::benchmark, &runner);
}void stopBenchmark()
{runner.running = false;if (benchmark_thread.joinable()){benchmark_thread.join();}
}
重构了的性能测试代码
以 OOP 的方式提供使用:
#pragma once#include <atomic>
#include <thread>class BenchmarkRunner {
public:void benchmark(){constexpr int n = 4;std::thread threads[n];for (int i = 0; i < n; i++){threads[i] = std::thread([this] { this->run(); });}for (int i = 0; i < n; i++){threads[i].join();}}std::atomic<bool> running = true;
private:void run(){int i = 0;while (running){i++;}}
};
3.2 引入 imgui-SFML, 增加按钮
增加两个按钮, 注册它们的响应函数
ImGui::Begin("Hello"); // [imgui]ImGui::Button("Start Benchmark"); // [imgui]ImGui::Button("Stop Benchmark"); // [imgui]ImGui::End(); // [imgui]if (ImGui::Button("Start Benchmark")){startBenchmark();}if (ImGui::Button("Stop Benchmark")){stopBenchmark();}
main loop增加 imgui-SFML 的套路代码
标记为 [imgui-SFML] 的是新增的套路代码:
int main()
{constexpr int win_width = 800;constexpr int win_height = 600;const std::string title = "cpu consumption curve - SFML";sf::RenderWindow window(sf::VideoMode(win_width, win_height), title);window.setFramerateLimit(60);bool success = ImGui::SFML::Init(window); // [imgui-SFML]if (!success)return -1;constexpr int grid_len = 1;constexpr int bin_size = 10;constexpr int num_bins = win_width / bin_size;std::vector<float> cpu_usage(num_bins, 0);int frameIdx = 0;load1 = get_cpu_percentage();sf::Clock deltaClock;while (window.isOpen()){sf::Event event;while (window.pollEvent(event)){ImGui::SFML::ProcessEvent(window, event); // [imgui-SFML]if (event.type == sf::Event::Closed){window.close();}}ImGui::SFML::Update(window, deltaClock.restart()); // [imgui-SFML]frameIdx++;window.clear();//draw_sin_x_wave(win_width, win_height, grid_len, window);ImGui::Begin("Hello"); // [imgui]ImGui::Button("Start Benchmark"); // [imgui]ImGui::Button("Stop Benchmark"); // [imgui]ImGui::End(); // [imgui]if (ImGui::Button("Start Benchmark")){startBenchmark();}if (ImGui::Button("Stop Benchmark")){stopBenchmark();}if (1){if (frameIdx % 60 == 0){load2 = get_cpu_percentage();float cpu_use = getCpuUsePercentage();for (int i = 0; i < num_bins - 1; i++){cpu_usage[i] = cpu_usage[i + 1];}cpu_usage[num_bins - 1] = cpu_use;frameIdx = 0;}sf::VertexArray line(sf::LinesStrip, num_bins);for (int i = 0; i < num_bins; i++){float usage = cpu_usage[i];float x = i * bin_size;float y = win_height - (usage / 100) * win_height;line[i].position = sf::Vector2f(x, y);}window.draw(line);printf("cpu_usage[%d] = %f\n", num_bins - 1, cpu_usage[num_bins - 1]);}ImGui::SFML::Render(window); // [imgui-SFML]window.display();}return 0;
}
效果如下
当按下了 Start Benchmark 后, CPU 占用率曲线飙升到 50% 左右(因为开了 4 个线程); 当按下 Stop Benchmark 后, 曲线会降低下来:
4. 提高绘制频率
github 上找到的 CPU-Profiler 项目, 运行的时候的能够以低于 1 秒的频率更新绘制曲线, 相关实现在 src/Consumption/TotalConsumption.cpp 和 src/Consumption/TotalConsumption.hpp 中, 和前面提到的 CSDN 参考博客实现方法, 调用了同样的 host_statistics() 函数和参数:
double TotalConsumption::getCurrentValue()
{host_cpu_load_info_data_t cpuInfo;mach_msg_type_number_t count = HOST_CPU_LOAD_INFO_COUNT;if (host_statistics(mach_host_self(), HOST_CPU_LOAD_INFO, (host_info_t)&cpuInfo, &count) == KERN_SUCCESS){unsigned long long totalTicks = 0;for (unsigned cpu_tick : cpuInfo.cpu_ticks)totalTicks += cpu_tick;return calculate(cpuInfo.cpu_ticks[CPU_STATE_IDLE], totalTicks);}elsereturn -1.0f;
}
CPU-Profiler 的绘制很快, 并且没有取值为 0 的 cpu占用率突变点(折线的突然截断没显示,因为数值是 nan), 因为作者判断当执行除法的分母(也就是总时间)是 0 的时候,返回 100.0 而不是 0.0:
float TotalConsumption::calculate(unsigned long long idleTicks,unsigned long long totalTicks)
{auto totalTicksSinceLastTime = totalTicks - _previousTotalTicks;auto idleTicksSinceLastTime  = idleTicks  - _previousIdleTicks;float diff = static_cast<float>(idleTicksSinceLastTime) / totalTicksSinceLastTime;float ans = 1.0f;if (totalTicksSinceLastTime > 0)ans -= diff;_previousTotalTicks = totalTicks;_previousIdleTicks  = idleTicks;return ans * 100;
}
我们照搬这个做法到自己的代码:
float getCpuUsePercentage()
{load2 = get_cpu_percentage();// pre load timesunsigned long long current_user = load1.cpu_ticks[CP_USER];unsigned long long current_system = load1.cpu_ticks[CP_SYS];unsigned long long current_nice = load1.cpu_ticks[CP_NICE];unsigned long long current_idle = load1.cpu_ticks[CP_IDLE];// Current load timesunsigned long long next_user = load2.cpu_ticks[CP_USER];unsigned long long next_system = load2.cpu_ticks[CP_SYS];unsigned long long next_nice = load2.cpu_ticks[CP_NICE];unsigned long long next_idle = load2.cpu_ticks[CP_IDLE];// Difference between the twounsigned long long diff_user = next_user - current_user;unsigned long long diff_system = next_system - current_system;unsigned long long diff_nice = next_nice - current_nice;unsigned long long diff_idle = next_idle - current_idle;load1 = load2;float total = diff_user + diff_system + diff_nice + diff_idle;if (total > 0) // 如果没有判断 total > 0, total 有时候是 0,会导致 value 是 nan,进而出现cpu占用率折线图的 突然截断{return static_cast<float>(diff_user + diff_system + diff_nice) / static_cast<float>(total) * 100.0;}return 100.0;
}
对我我的实现和 CPU-Profiler 的实现:
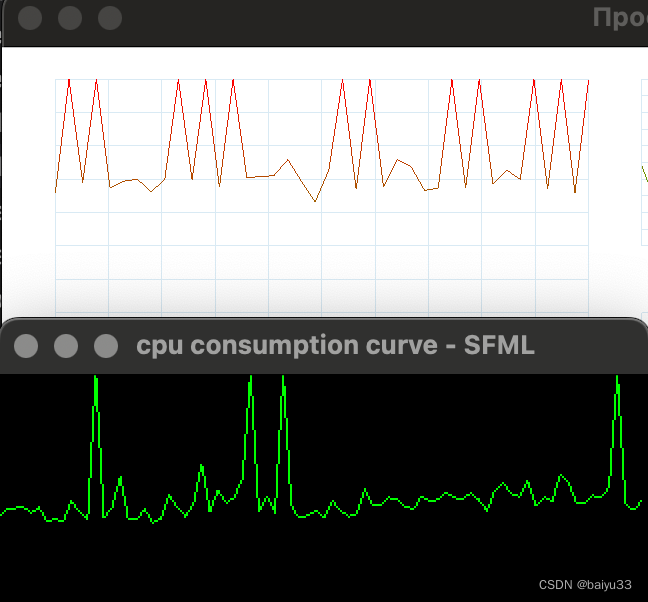
5. 总结
本篇使用 C++ 实现了一个简陋的 CPU 占用率界面程序, 给出了实现的关键部件, 以及一些探索过程。
从界面上看, 能够绘制所有 CPU 的总体占用率曲线, 并且按照1 秒(或更短)为间隔,更新CPU占用率的值并绘制折线; 通过提供两个按钮,触发独立的线程来执行 “benchmark 测试程序”。使用独立线程的原因是为了避免阻塞 UI 显示的主线程。
所谓 benchmark 测试程序, 是基于《编程之美》一书开头提到的控制 CPU 占用率曲线的问题, 写了一个让单个CPU占用率 100%、 通过多线程运行, 从而让多个 CPU 核心的占用率都到 100%。 使用多个线程的原因是 macOS 不提供 CPU 绑核(亲和性)的 API, 为了防止测试程序在不同 CPU 上乱跳, 索性多开几个线程来运行。
从界面的实现来看:
-
首先基于 SFML 绘制了曲线, 由于要绘制多个点,
sf::VertexArray的绘制效率远远高于sf::RectangleShape, 前者只需要一次绘制, 后者则需要 n 次绘制, 可以在 SFML Tutorial - Designing your own entities with vertex arrays 文章中得到解释。 -
然后使用 macOS 的 API host_statistics() 的封装代码, 通过前后两次计算差值来获取 CPU 占用率。 对于差值的计算, 时间间隔不能太快, 太快的话会获取到总时间为0, 参考了 CPU-Profiler 的做法, 也就是此时的 CPU 占用率赋值为100%, 这其实并不准确。
-
为了减少评测代码和 CPU占用率绘图代码的切换繁琐问题, 在GUI上创建了按钮,通过按钮触发了性能测试程序的启动和停止。 这些按钮的添加, 按钮本身是 imgui 的东西, 通过 imgui-SFML 框架, 得以和原本的 SFML 窗口渲染程序结合显示。
这个程序并不完美, 比如只支持了 macOS 而没有支持 Windows/Linux, 评测程序过于简单只做了100% CPU 占用的实现、 没有实现正弦曲线的绘制。有空会考虑补充实现。
References
- SFML Tutorial - Designing your own entities with vertex arrays
- c++获取windows、mac的cpu利用率
- CPU-Profiler
- host_statistics - Apple Docs


![代码随想录算法训练营第二十四天 | 回溯算法理论基础,77. 组合 [回溯篇]](https://img-blog.csdnimg.cn/direct/1193fd9de845464e9dbcca47caf8a462.png)